Our Goal
How and why we took these photographs:
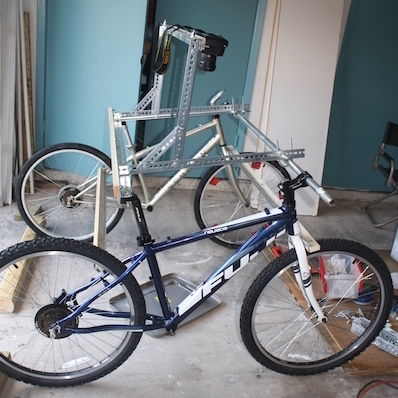
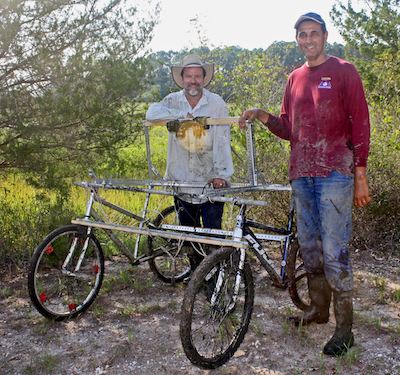
We’re interested in better understanding the spatial relationships among the different salt marsh species. For example, snails may associate closely with one plant species and avoid another. To examine these relationships, we need a map that shows the locations of all the species. Think of Google Earth — it has transformed how scientists in many disciplines work, because it allows them to see spatial relationships over a large landscape. But Google Earth doesn’t get close enough to the ground to see individual plants or snails. So it is not useful for community ecologists. That’s where we come in. We built a carriage that suspends a camera between two bicycles. The camera points down, about 45 inches above the ground, and takes photographs with enough resolution to see individual crabs, snails and plants. |
|
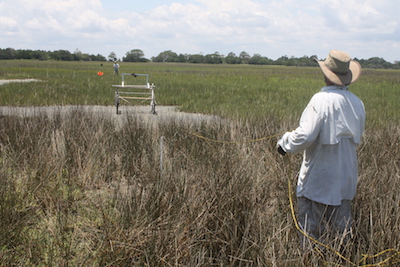
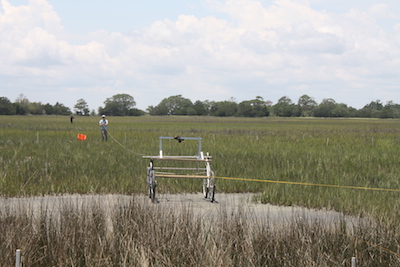
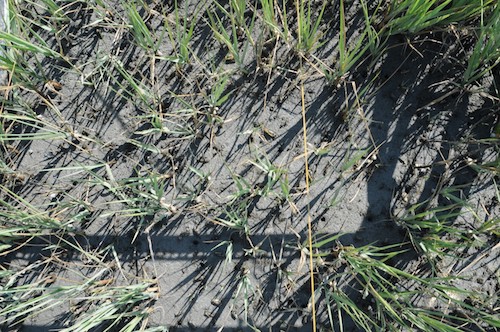
| We pull the carriage back and forth across the marsh using ropes.
This avoids disturbing the area very much because we don’t have to walk over the area that we’re photographing. The carriage is pretty light and doesn’t create much disturbance. The camera is set to take photographs every second. You can see the shadow of the carriage in many of the photographs. The yellow string helps us pull the carriage back and forth in a straight line. Because we’re moving the carriage slowly, the images overlap. And when we go back and forth, we make sure that the rows overlap. Because the area that we’re photographing is large (about 3,200 m2), we end up with 10-15 thousand photographs from one session. |
|
Using the Marsh Explorer web site, volunteers also tell us what’s in each photograph. This allows us to create a map of abundance for each species that is derived from the photo-mosaic. This map is what we’ll use for our research. In addition to understanding the spatial relationships of the species at a given time, we can look at change in these relationships over time, because we have seven years of photographs. During this time we had substantial changes in the weather at the site and the plant distributions. We will be able to document these by seeing how the map changes from one year to the next. |
|
|
|